Quit Risk Audit Tool
Predict bounce rates • Analyze readability • Accessibility • Performance
Analyzing Quit Risk...
Frequently Asked Questions – UX Design Insights
How does readability impact user experience in web design? ▼
What is the effect of navigation on user experience in websites? ▼
Why is accessibility important for user experience in web design? ▼
How do mobile optimization and PWAs influence user experience on the web? ▼
What role does website performance play in user experience? ▼
How the Quit Risk Tool Works? ↓
Instant, Privacy-Safe UX Health Audit
This bounce rate predictor performs a real-time usability analysis by securely fetching your page’s HTML via our CORS proxy and parsing the DOM entirely in your browser.
No data leaves your device. Everything processes instantly and privately on-device for complete security.
The 5 Core UX Factors Analyzed
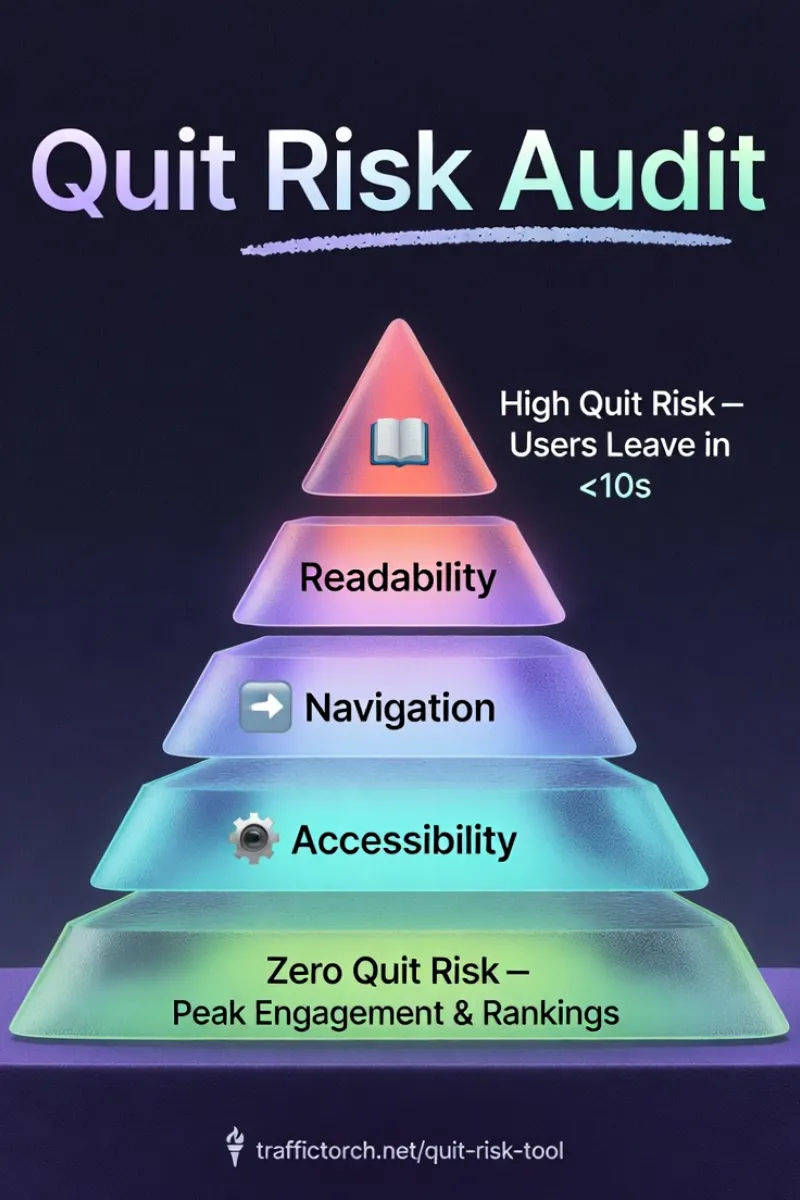
- Readability Scoring: Flesch Reading Ease & Kincaid grade level on main content: rewards clear, scannable writing.
- Navigation Clarity: Link density and menu structure evaluation to avoid cognitive overload.
- Accessibility Health: Proxy checks for alt-text coverage, contrast, and semantic structure (WCAG-inspired).
- Mobile & PWA Readiness: Viewport configuration, responsive design, touch targets, and progressive web app compliance.
- Performance Optimization: Asset volume flags, script/font bloat detection, lazy loading opportunities.
These factors combine into a 0–100 Usability Score that predicts potential bounce rate ranges.
You get a color-coded breakdown, prioritized fixes ranked by impact, and predictive engagement forecasts based on proven UX-SEO correlations.
Key Insight
High quit risk directly increases bounce rates and reduces dwell time. Sending negative behavioral signals that harm SEO rankings over time.
Deep Dive into Key Modules
What is Quit Risk?
Quit Risk measures how likely a visitor is to bounce in the first 10–30 seconds. Before they ever engage with your content or convert.
Most sites treat bounce rate as a vague vanity metric. Today it's a direct signal of failure.
High quit risk kills rankings, destroys conversions, wastes ad spend, and tells search engines your page doesn't deserve traffic.
Modern site usability is driven by these silent killers:
- → Slow load & poor Core Web Vitals.
- → Confusing or cluttered first screen.
- → No instant value or trust signals.
- → Mobile frustration & bad touch targets.
Traffic Torch UX Analyzer gives you an instant score + deep breakdown of common UX factors. With prioritized fixes to turn visitors into engagers.

5 High-Impact Moves to Reduce Usability Risks
Big headline + subhead + visual hook that answers "why should I stay?" immediately.
Massive whitespace, single-focus hero, no aggressive pop-ups or sticky bars on arrival.
Large readable text, generous tap targets, no horizontal scroll, fast touch response.
Visible author photo/bio, social proof, secure badges, clear branding. Create clear credibility.
One clear next step (scroll, click-to-call, form, video play) — no decision paralysis.
Old UX Thinking vs Modern Quit-Risk
| Factor | Old-School UX Thinking | Modern Quit-Risk Mastery Focus |
|---|---|---|
| Primary Metric: | Overall bounce rate. | High UX & usability score. |
| Speed Priority: | Under 3–5 seconds is "fine". | Sub-2.5s LCP required — table stakes. |
| First-Screen Focus: | Pretty hero image + logo. | Instant value + trust + clear next action. |
| Mobile Experience: | Responsive checkbox. | Mobile-first, touch-optimized, fast interaction. |
| Trust Signals: | Footer links & copyright. | Visible authorship, social proof, security — above fold. |
| Conversion Path: | Multiple CTAs & options. | Single obvious low-friction first step. |
When you eliminate quit risk, visitors stay, engage, convert — and search engines reward you with better rankings.
UX Tools
Ultimate Bounce Rate Reduction Checklist
Free instant bounce rate predictor and comprehensive UX health audit. Get your Quit Risk Score with deep analysis of readability, mobile/PWA optimization, performance, accessibility, and navigation. Plus prioritized fixes to lower bounce rates and boost engagement.
Usability & UX Checklist 🗝️ ↓
Key Dos & Don'ts to Reduce Bounce Rates
- ✅ Do: Load critical content above the fold for instant value.
- ❌ Avoid: Pop-ups or interstitials that block main content on entry.
- ✅ Do: Use clear, benefit-driven headlines that match user intent.
- ❌ Avoid: Misleading titles or slow-revealing core information.
- ✅ Do: Optimize images and enable lazy loading below fold.
- ❌ Avoid: Heavy hero images or autoplay videos without user consent.
- ✅ Do: Include internal links to related content for deeper engagement.
- ❌ Avoid: Dead-end pages with no clear next steps or CTAs.
📖 Readability & Content Experience
📱 Mobile & Performance Audit
♿ Accessibility & Navigation Flow
📊 Quit Risk Score & Insights
Use this UX health checklist to lower bounce rates, predict engagement drops, and improve SEO through better user experience.
Why UX & Quit Risk Matter? ↓
User Experience Is a Direct Ranking Factor
Search engines now heavily weigh real user signals: high bounce rates, short dwell time, and pogo-sticking all indicate poor experience.
Pages that cause visitors to leave quickly are gradually demoted. Even with perfect technical SEO.
What Strong UX Delivers
Satisfied users explore more pages and send positive quality signals.
Fewer immediate exits improve perceived relevance and authority.
Memorable, frictionless experiences encourage repeat visits.
UX-focused sites perform better during algorithm shifts prioritizing user satisfaction.
The Bottom Line
Excellent usability isn’t optional — it’s a core competitive advantage in modern, user-first search algorithms.
Reduce quit risk → Lower bounce rates → Stronger behavioral signals → Higher rankings and conversions.
Prioritizing user experience is the most sustainable SEO strategy.
Traffic Torch
User experience analysis and engagement optimization audit tools.
The tool is built to specialize in identifying UX friction points that cause users to leave pages quickly. This is developed through analysis of real-world pages, combining proven usability metrics with modern engagement signals used by search engines.

Ylia Callan – Lead Developer
Musician • Author • Researcher • Web Designer • TAFE NSW • Creator of privacy-first SEO, GEO, AIO & UX web tools. Bridging creativity, consciousness exploration, and modern technology to build meaningful, performant, and user-centric experiences.
Explore my work - books on physics, philosophy, consciousness, music, and more – at yliacallan.github.io.
Modern Stack Setup
Traffic Torch runs on epic, scalable infrastructure: Hosted via GitHub Pages for blazing-fast static delivery and effortless updates. Protected and accelerated globally by Cloudflare with edge CDN, security, and performance optimizations.
Backed by real-world expertise in UX research, engagement analytics, and search performance.
Published: 2025-12-18
Last updated: 2026-03-06